are representation of direct reality, which comes in the forms of signs and symbols

Drawings
a drawing may not be real thing but better to have a concrete visual aid that nothing. To avoid confusion, it is good that our drawing correctly represent the real thing.
Cartoons
another visual symbol that can bring novelty to our teaching is the cartoon . A first rate cartoon tell its story metaphorically.
Strip Drawings
A sequence of drawing in a news paper, magazine and etc. relating in a humorous story or an adventure.

Diagrams
" It is any line drawing that show arrangement and relations as of parts to the whole relative values origins and development chronological fluctuations , distribution etc " Dale 1969

TYPES OF DIAGRAM
Affinity Diagram
used to cluster complex apparently unrelated data into natural and meaningful groups.

Tree Diagram
used in increasing details or various task that must be accomplished to compete the project.

Fish bone Diagram
cause and effect diagram

Charts
It is a diagrammatic representation of relationships among individuals within an organizations.
Types of Charts
Time Chart - tabular time chart that presents data in ordinal sequence.

Tree or Stream Chart
depicts development, growth and change by beginning with a simple course with spread outs into many branches

Flow Chart
visual way of showing a process from beginning to end

Organization Chart
Show how one part of the organization relate to other parts of organization.

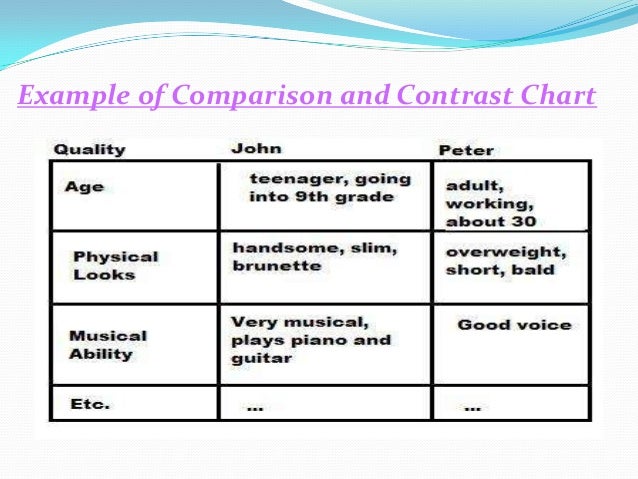
Comparison and Contrast Chart
show similarities and differences.
Pareto Chart
Type of bar chart, prioritize in descending order of magnitude or importance from left to right

Gantt Chart
is an activity time chart

Graphs
Pictures that help us understand data.
Types of Graphs
Circle Graph
recommended for showing parts of whole.

Bar Graph
use in comparing the magnitude of similar items at different ties or seeing relative sizes of the parts of a whole

Pictorial Graph
make use of picture symbols

Graphic Organizer
you met several graphic organizers in your subject, principles and teaching.

Maps
Is a representation of the surface of the earth or some part of it.
Types of Maps
Physical Map
altitude, temperature, rainfall, precipitation, vegetation and soil.

Relief Map
Three dimension represent and show contours in the physical data of the earth or part of the earth

Political Map
gives detailed information about country, province, lakes, river and etc.

Walang komento:
Mag-post ng isang Komento